ooragan.plot_triptych#
- ooragan.plot_triptych(freq: ArrayLike, complex_data: ArrayLike, resonator_fitter: ResonatorFitter | None = None, freq_unit: Literal['GHz', 'MHz', 'kHz'] = 'GHz', title: str | None = None, three_ticks: bool = False, figure_style: str | Inherit = Inherit) SmartFigure[source]#
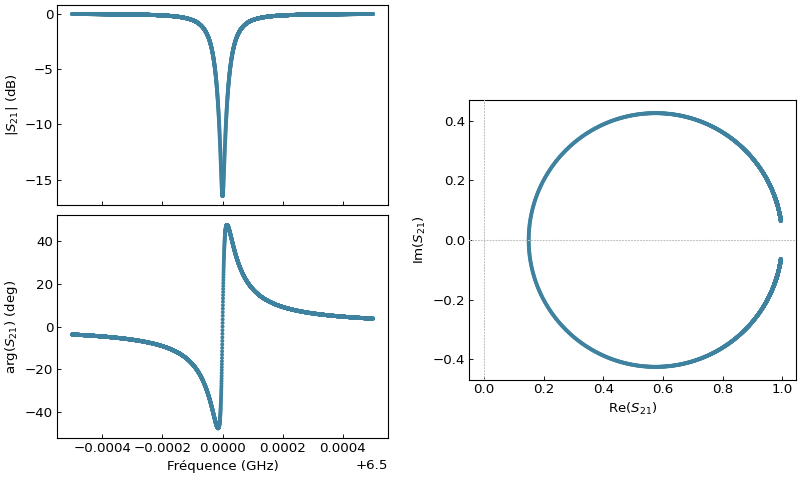
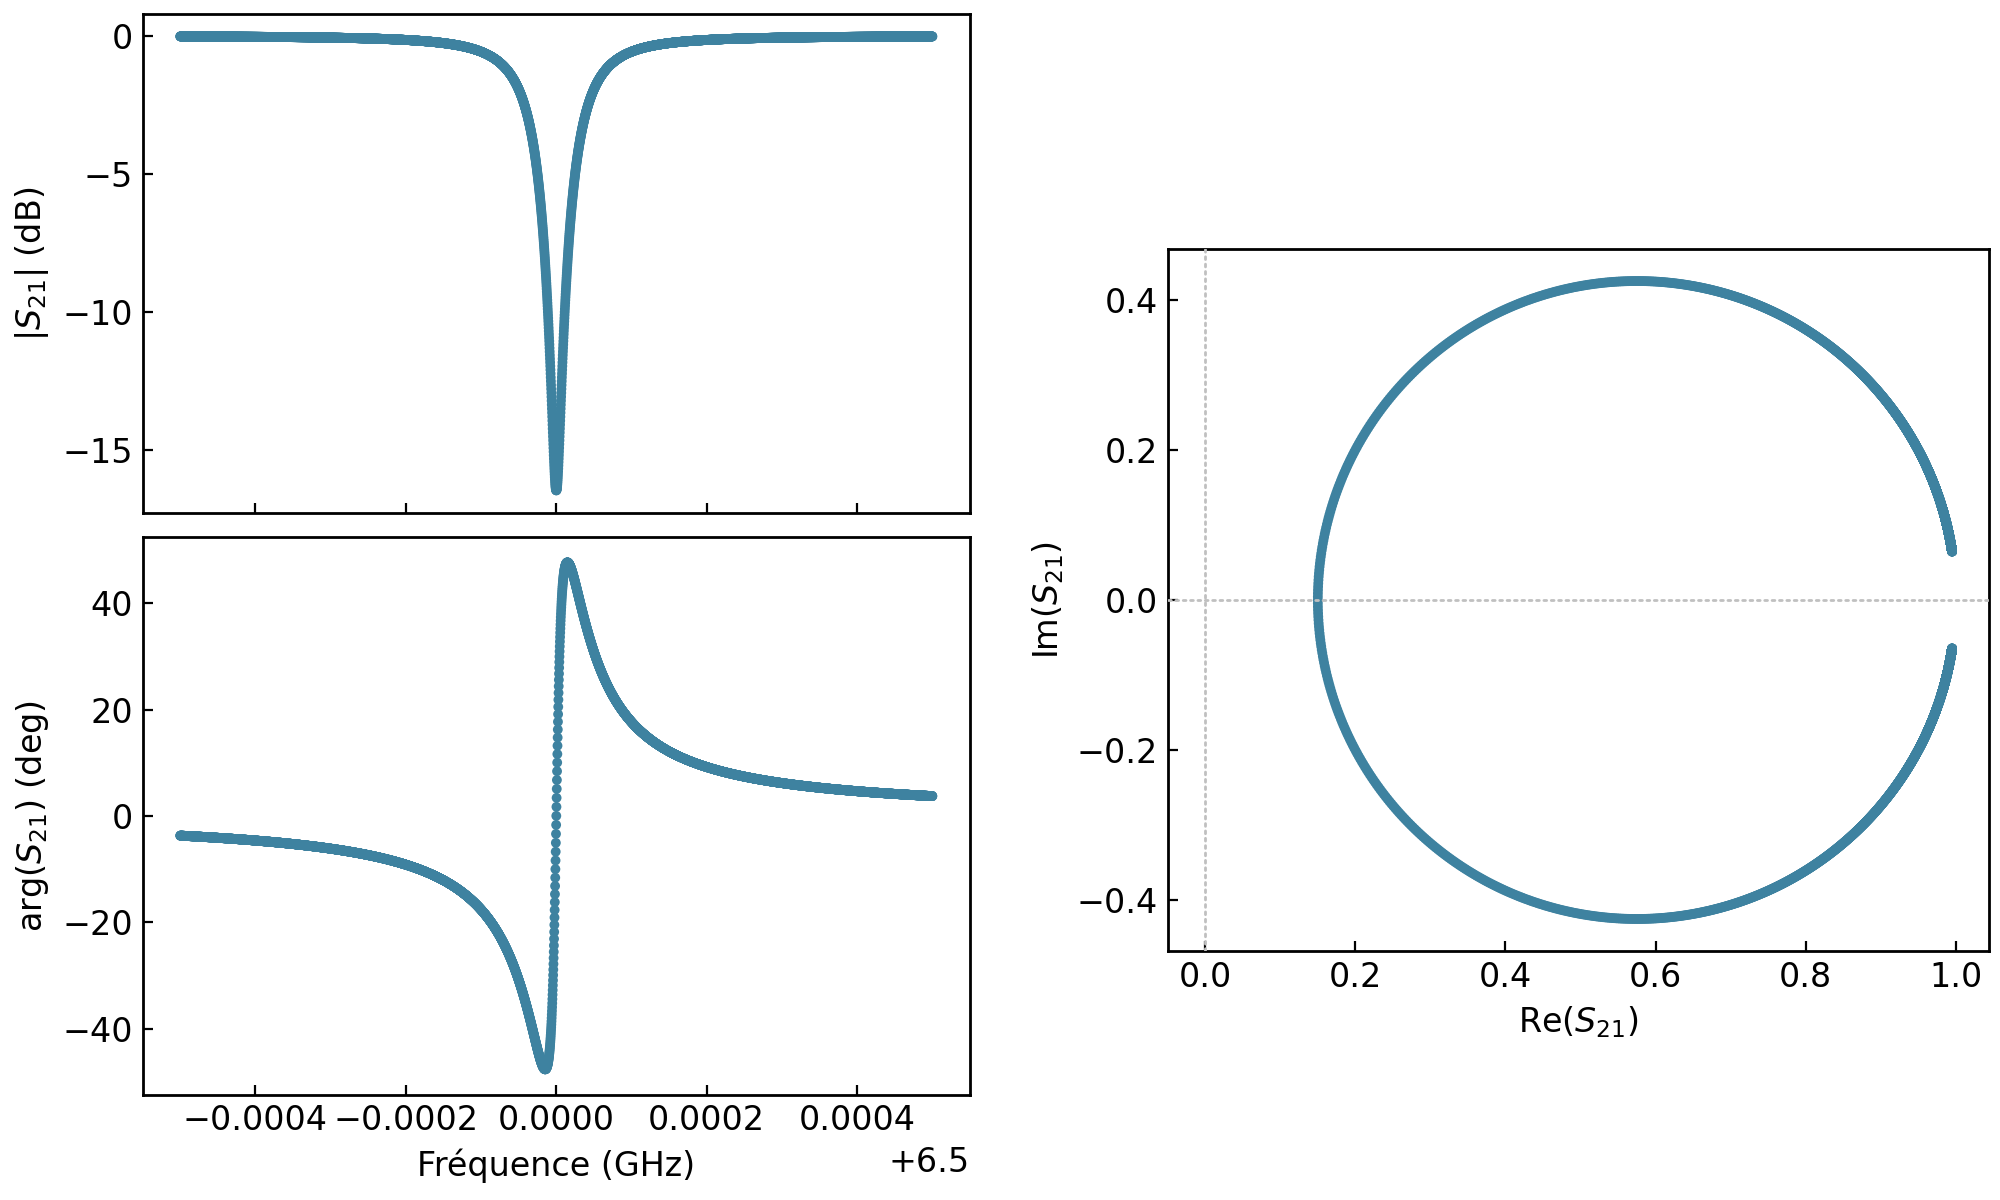
Plots the magnitude vs frequency, the phase vs frequency and the complex data in a single figure.
- Parameters:
- freqArrayLike
Frequency array.
- complexArrayLike
Complex data array.
- resonator_fitterResonatorFitter, optional
Fit result from the resonator library. Defaults to
None.Note
If a
ResonatorFitteris provided, the fit and the resonance frequency obtained from the fit are displayed.- freq_unit{“GHz”, “MHz”, “kHz”}, optional
Unit in which the frequency is given. Defaults to
"GHz".- titlestr, optional
Title of the figure. Defaults to
None.- three_ticksbool, optional
If
True, only three ticks will be displayed on the x axis: the minimum frequency, the maximum and the frequency. Defaults toFalse.- figure_stylestr or Inherit, optional
GraphingLib figure style to apply to the plot. See here for more info.
Examples
import numpy as np
from ooragan import plot_triptych

# Generate data from theoretical model
def S21(f, Q, Qc, f0):
    return 1 - (Q / Qc) / (1 + 2j * Q * (f - f0) / f0)

Q = 85000
Qc = 100000
f0 = 6.5e9
tau = 0.0000001
a = 1
alpha = 0
phi = 0
frequency = np.linspace(6.4995e9, 6.5005e9, 5001)

fig = plot_triptych(
    frequency,
    S21(frequency, Q, Qc, f0),
)
fig.show()
(
Source code,png,hires.png,pdf)