ooragan.plot_power_dep_maps#
- ooragan.plot_power_dep_maps(fit_result: _FitResult, savepath: str | None = None, additional_rcparams: dict | None = None) None[source]#
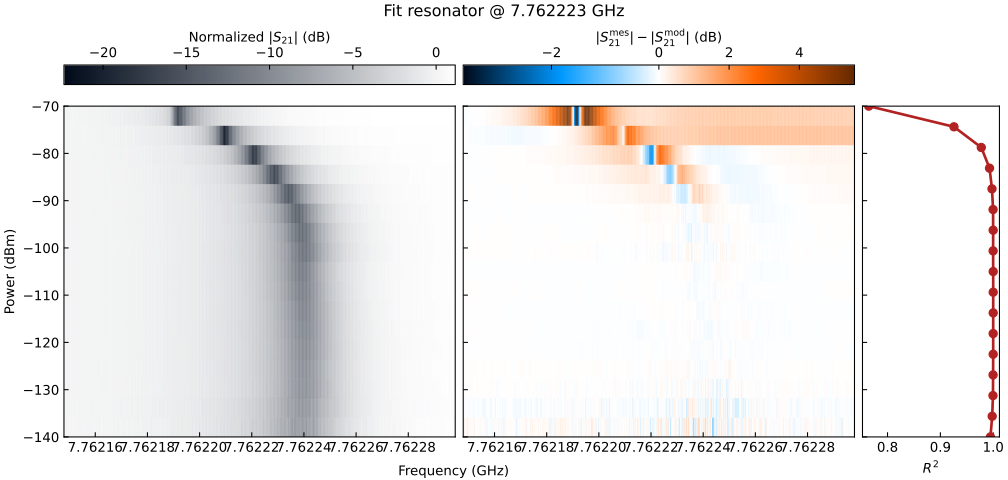
Plots the magnitude as function of frequency for all input powers as a 2D map. Also shows the difference of the data with the fitted model for each input powers and the \(R^2\). This is useful to get an overview of the quality of the fits.
- Parameters:
- fit_resultFitResult
Fit result to plot.
- savepathstr, optional
If specified, the figure will be saved at this path instead of being shown.
- additional_rcparamsdict, optional
Additional rcParams for the figure.
Examples